Happy New Year 2022! This is my first post of the year, and as a New Year’s gift from Ink Design, I am releasing a new “infoplamo”.
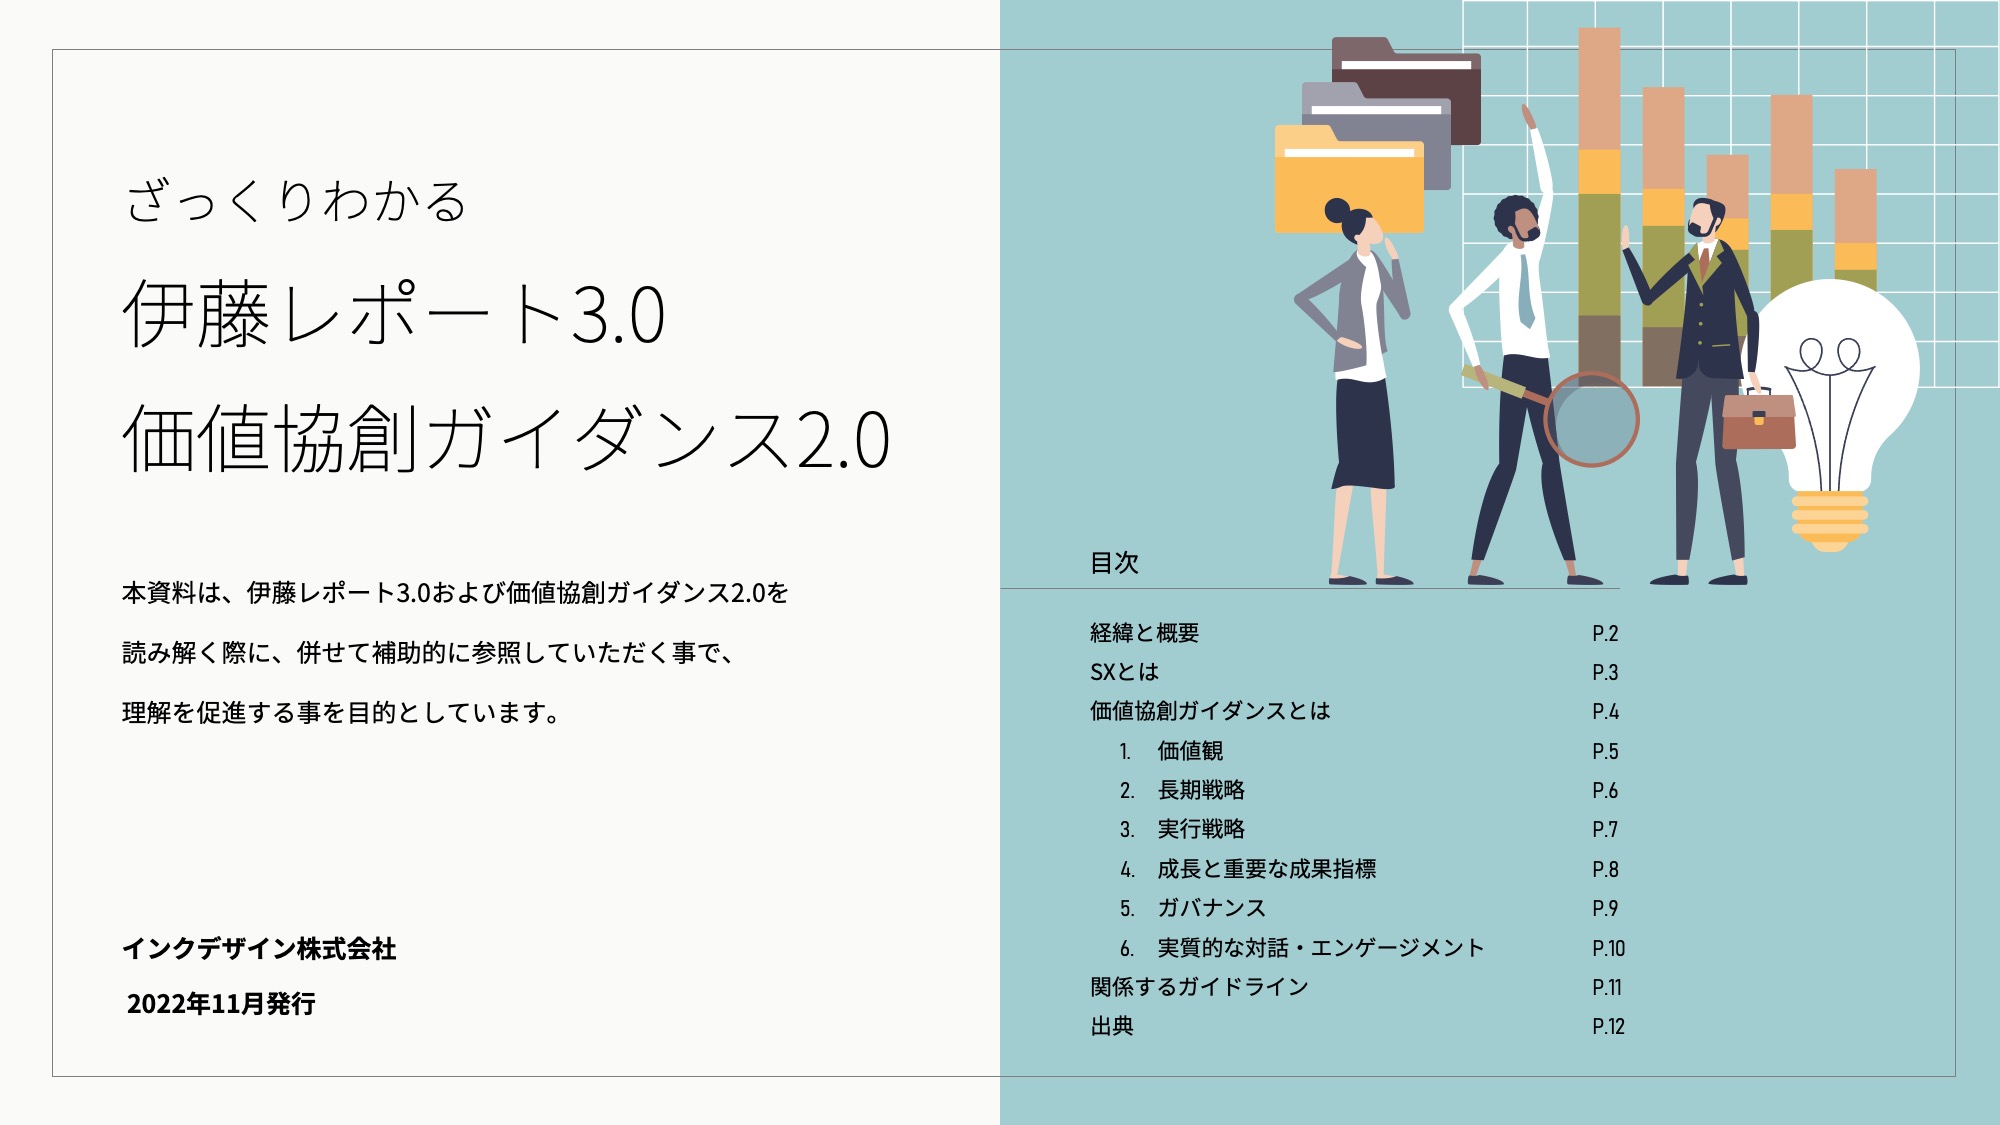
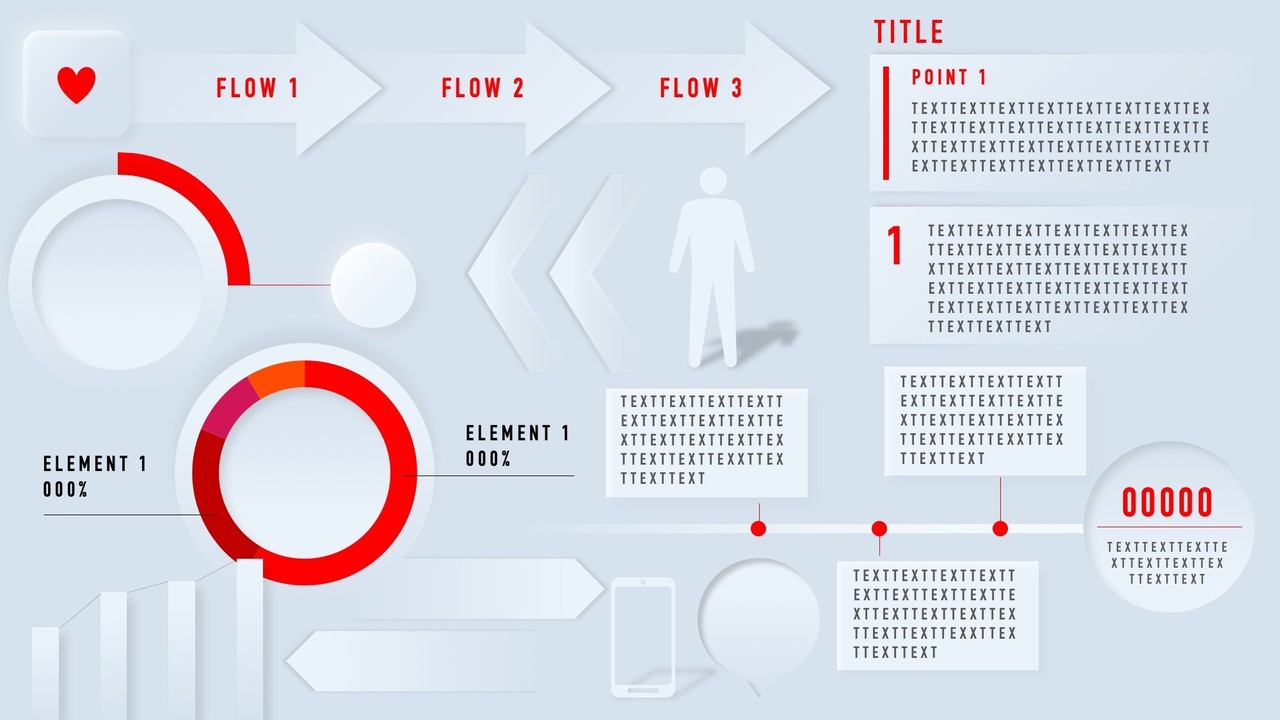
“Infoplamo” has been well received as an infographic that can be easily created in PowerPoint like a plastic model.
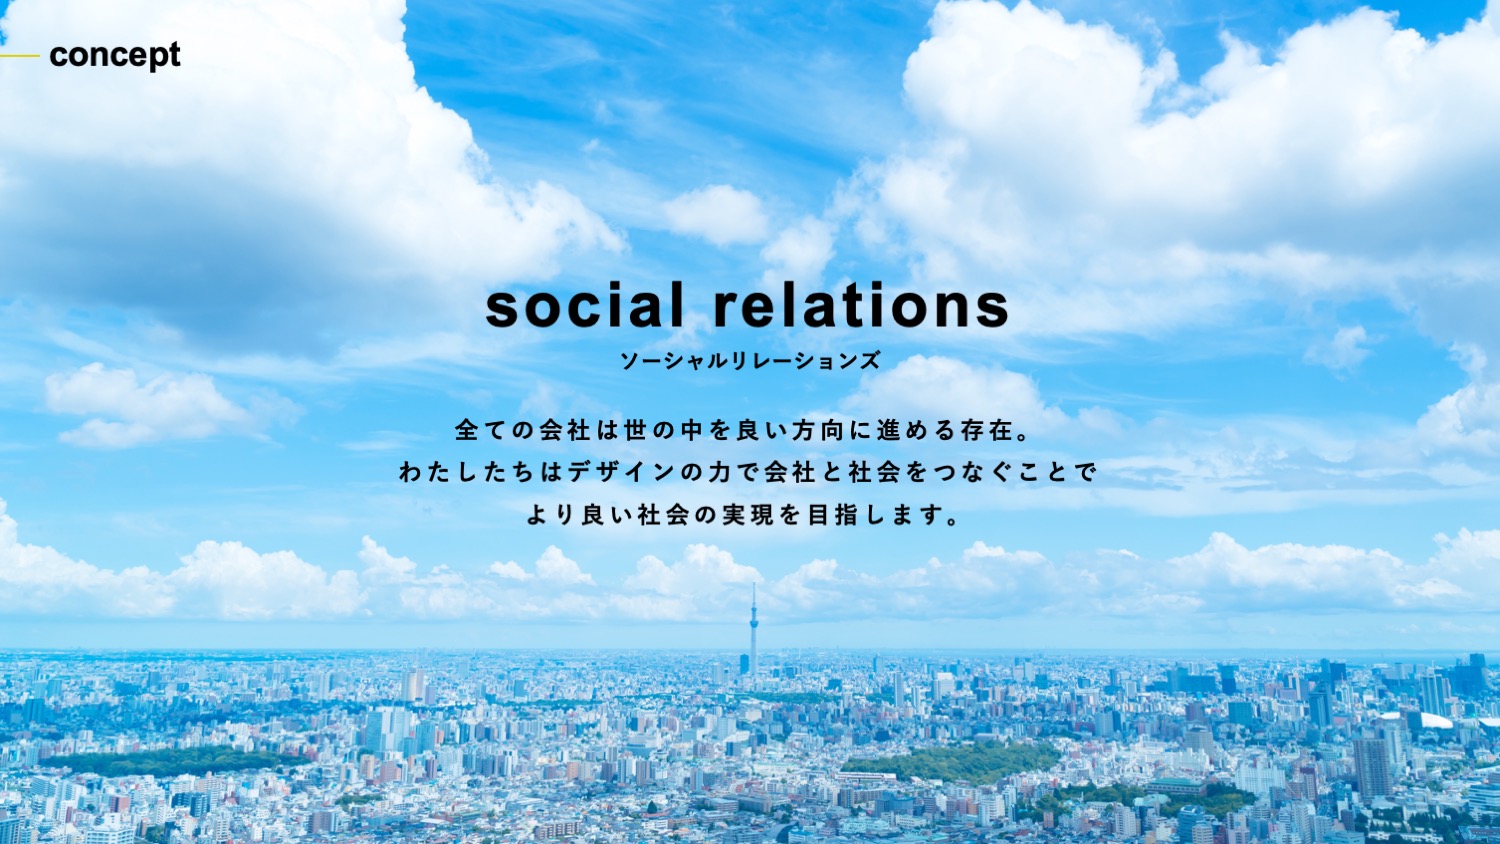
We live in a society where it is important for companies to have the concept of SDGs and ESGs. And it is also important to express actions and ideas of these kind of things.。
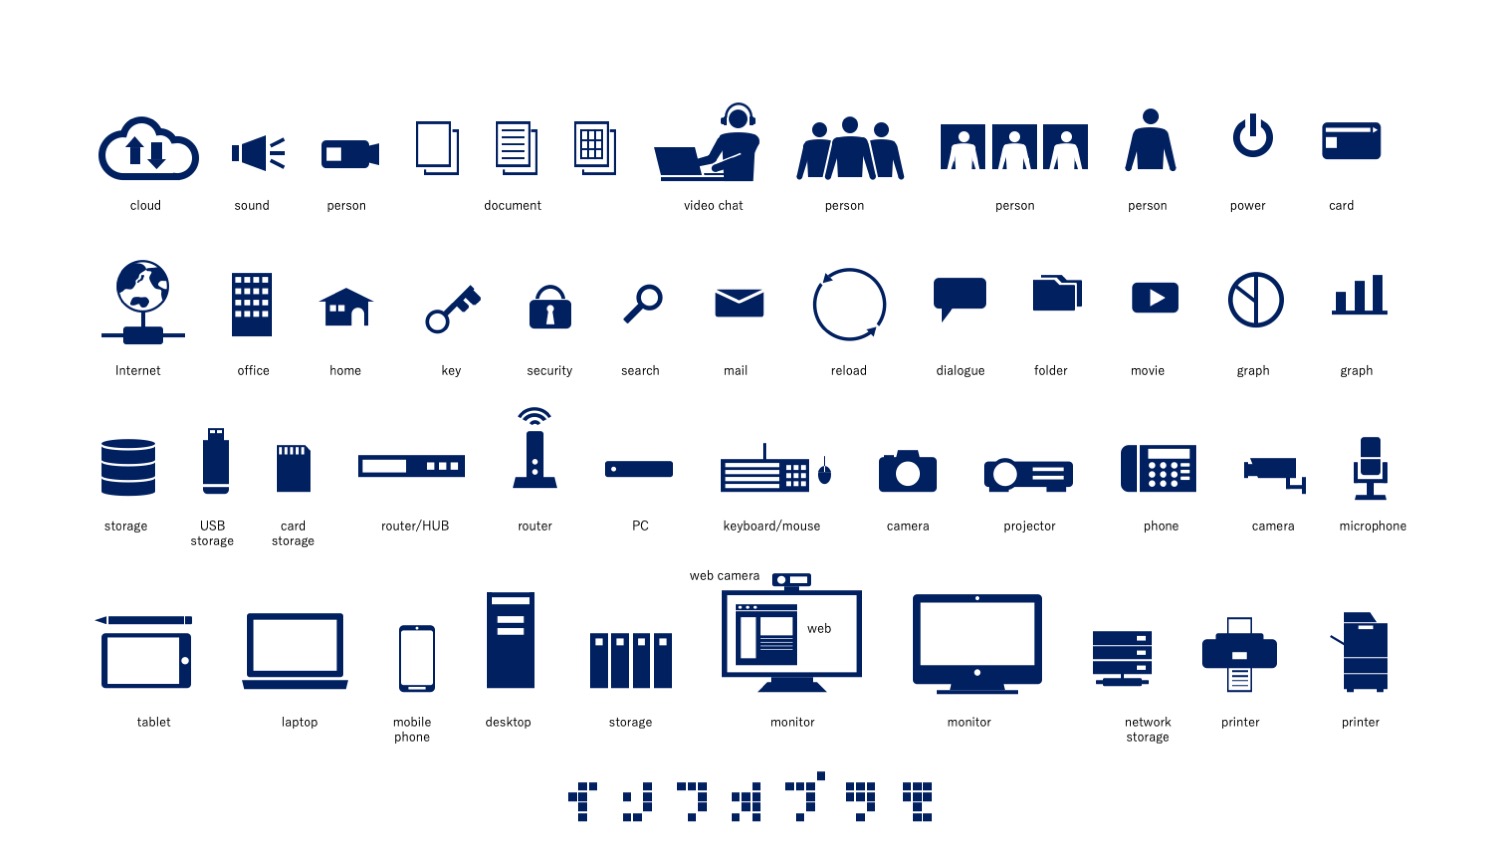
This time, I made a pictogram that you can use to explain ESG ideas in your documents in PowerPoint.
The graphs are made in PowerPoint, so it is easy to create infographic-like graphs. Please feel free to use it.
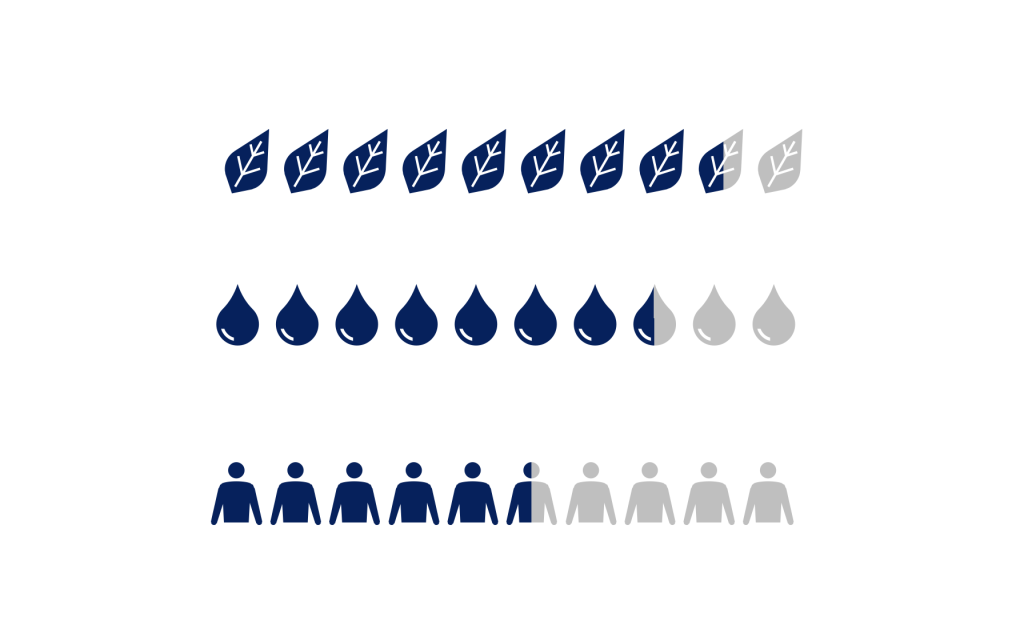
Click the link below download↓
We would be encouraged if you could twitter us with your feedback.
With the exception of the examples below, the distribution is free of charge for personal or corporate, commercial or non-commercial use.
We are not responsible for any problems or disadvantages caused by the distributed materials.
・Use for purposes offensive to public order and morals
・Use of the materials in a manner that damages the image of the materials
・Redistribution or sale of the material itself as content or merchandise (including LINE Creators Stamps, etc.)
・Any other use that the author deems inappropriate.




色々_むつき-3-200x200.jpg)
